Data visualization is a crucial skill in various fields, from scientific research to business analytics. Among the many methods available, the stem-and-leaf plot provides a simple yet effective way to organize and display numerical data. It allows us to quickly see the distribution of the data, identify clusters, and spot outliers without the complexity of more advanced statistical techniques. A stem-and-leaf plot is particularly helpful when working with relatively small datasets, making it a valuable tool for introductory statistics courses, quick data exploration, and basic reporting.
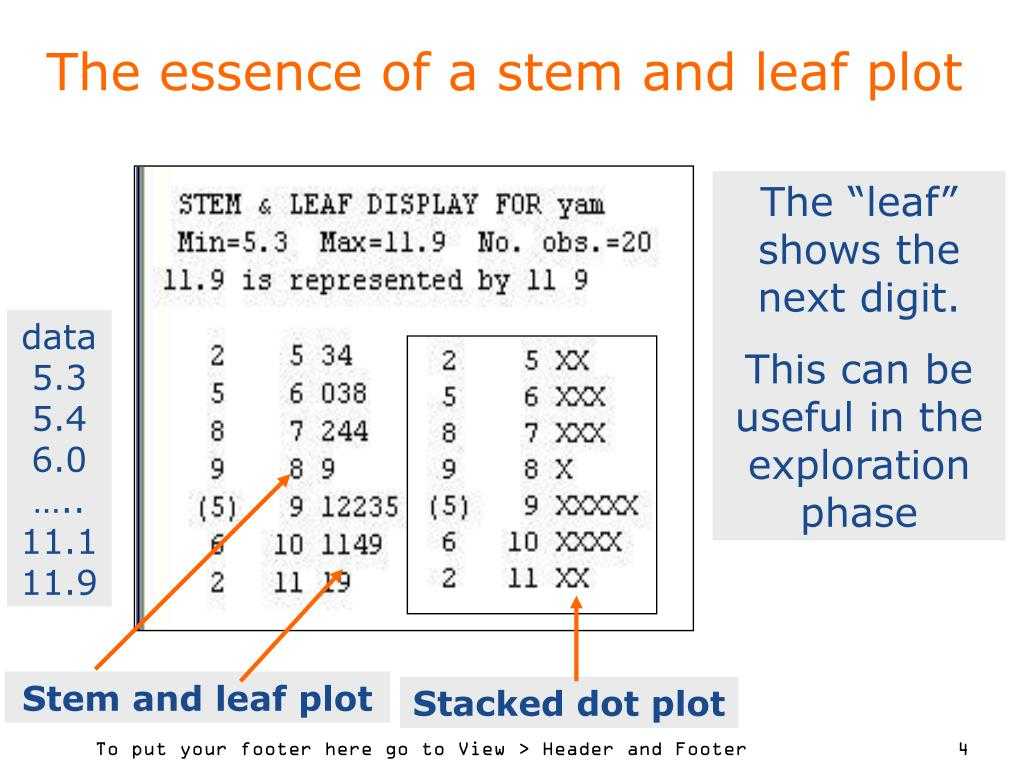
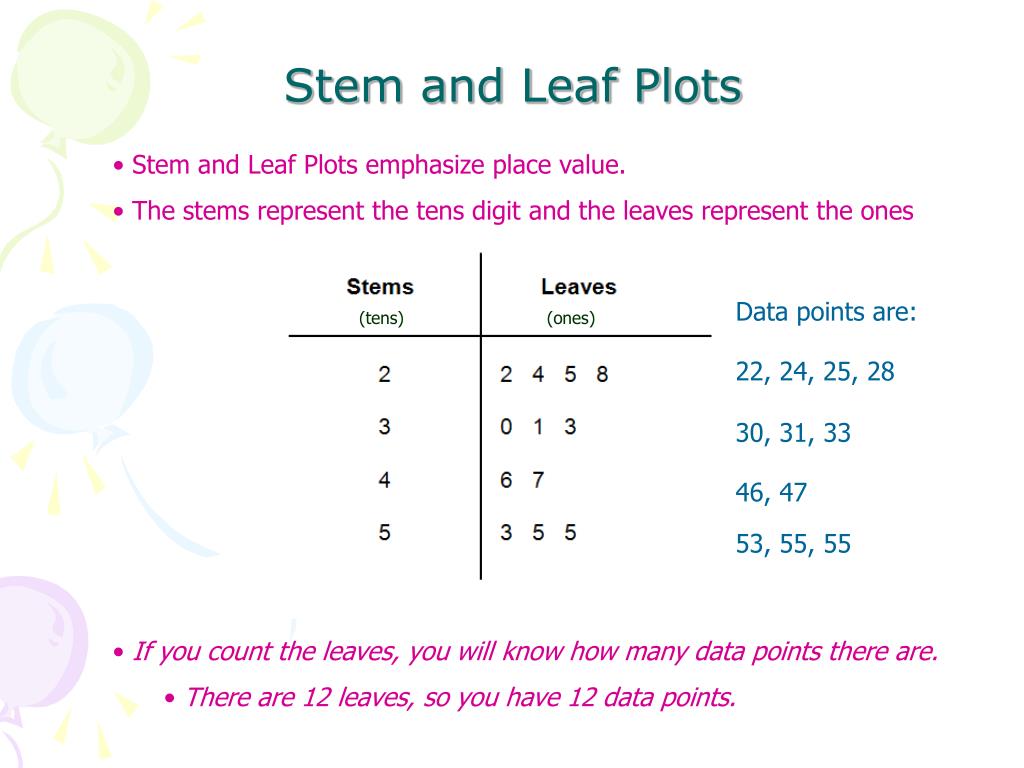
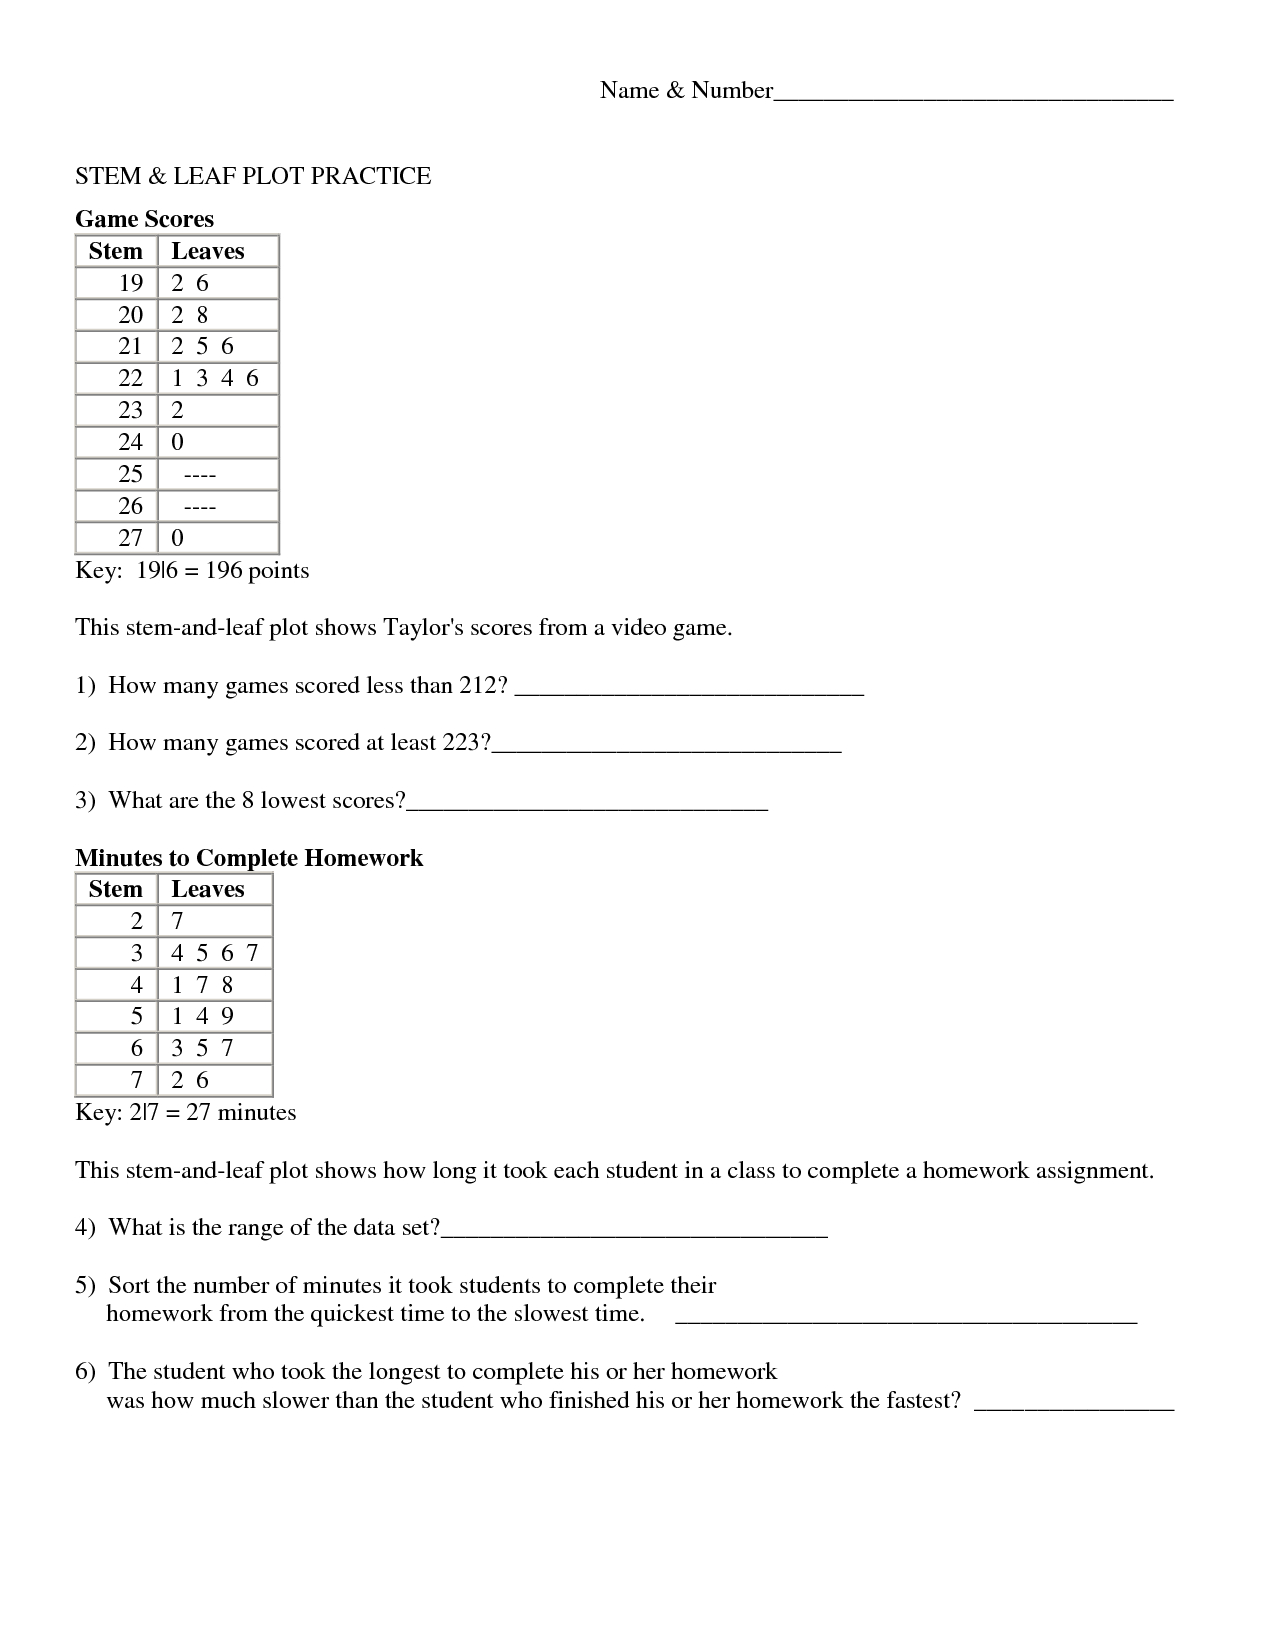
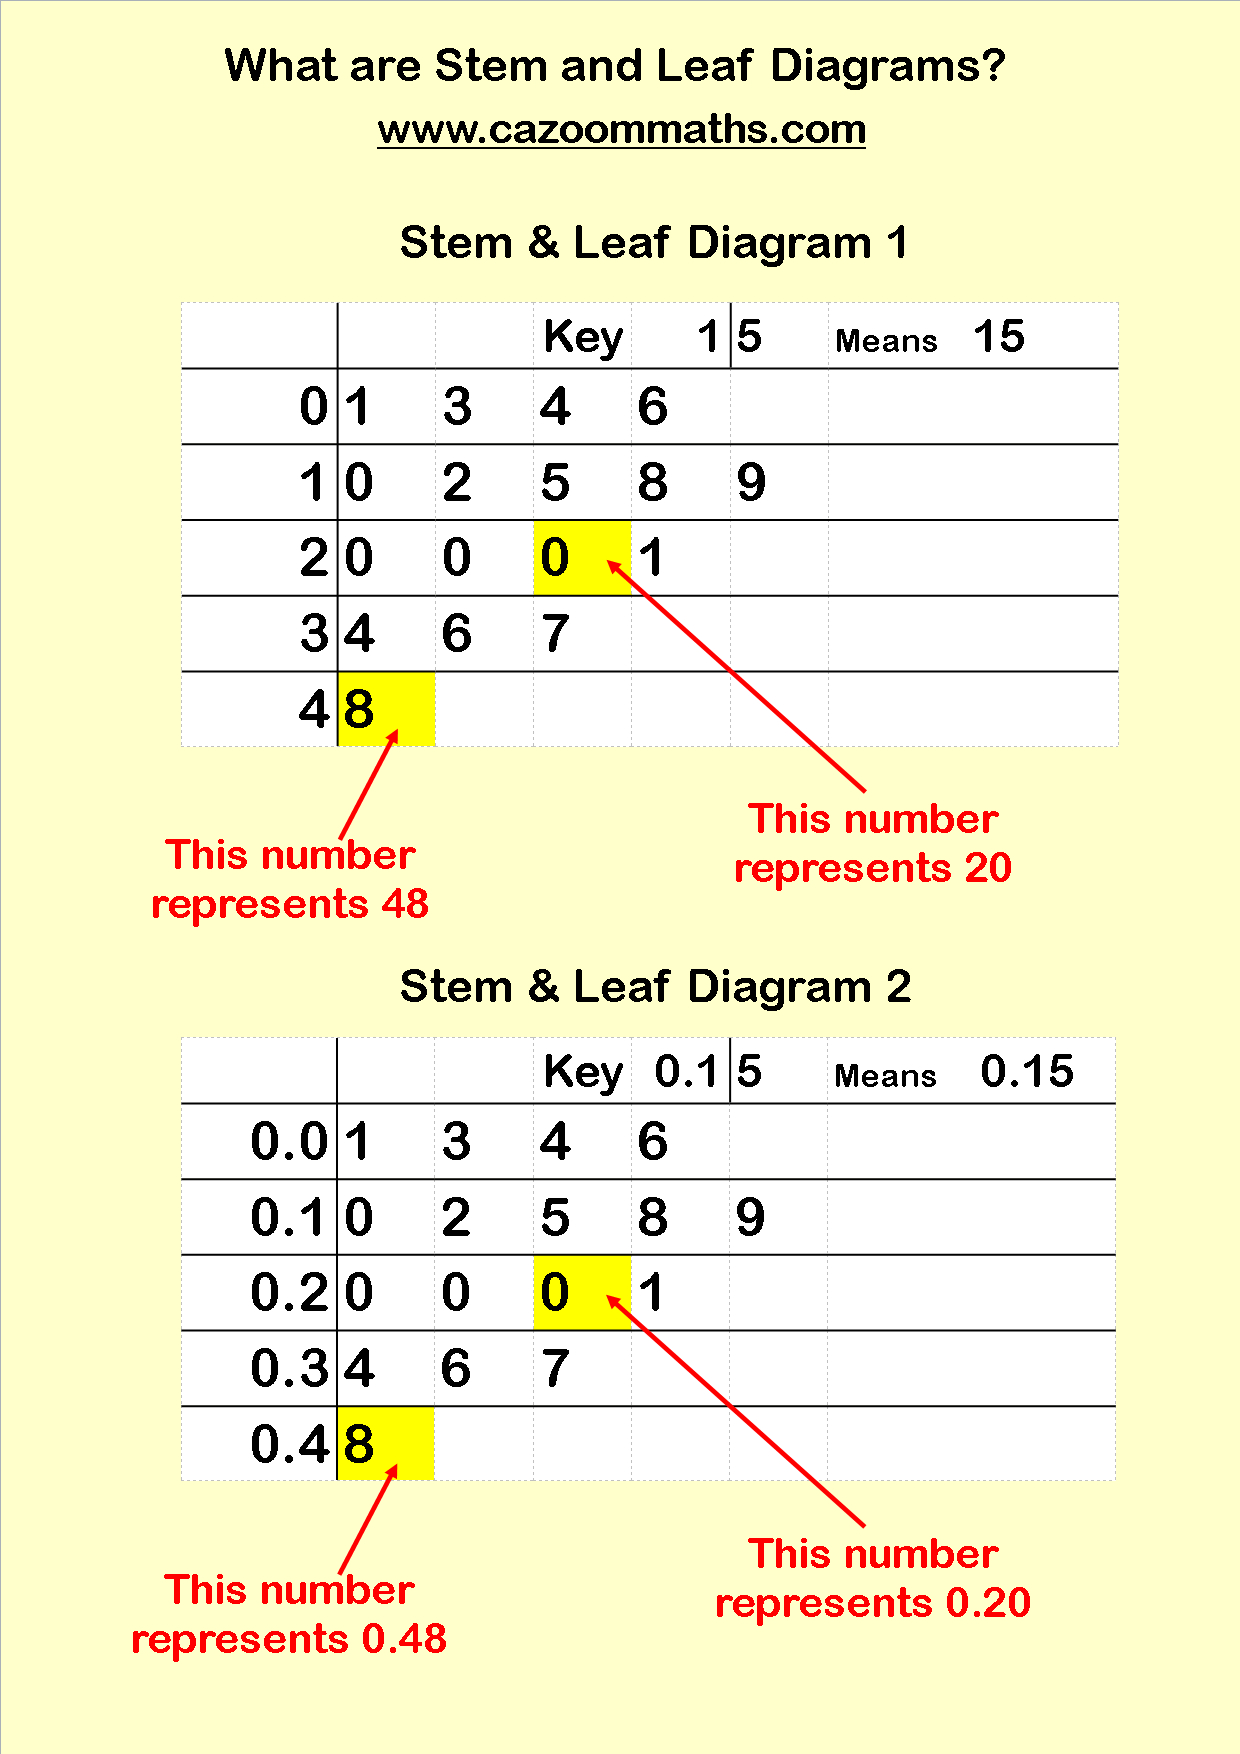
The beauty of a stem-and-leaf plot lies in its straightforward construction. The data is separated into two parts: the ‘stem’ and the ‘leaf’. Typically, the ‘stem’ consists of the leading digit(s) of a number, while the ‘leaf’ consists of the trailing digit. For instance, in the number 37, the stem could be ‘3’ and the leaf would be ‘7’. When multiple data points share the same stem, their corresponding leaves are listed next to the stem, arranged in increasing order. This simple arrangement creates a visual representation akin to a histogram, but with the added benefit of retaining the original data values.
While software packages and spreadsheets can automate the creation of stem-and-leaf plots, understanding the underlying principle and constructing them manually (or using a template) provides a deeper understanding of the data and its characteristics. This is especially true when teaching statistics or when working with data in situations where readily available software isn’t accessible. Using a blank stem-and-leaf plot template allows for focusing on data organization and interpretation, rather than being bogged down in the mechanics of creating the plot from scratch each time.
This document provides a blank stem-and-leaf plot template that you can copy and use. Following the template ensures consistent formatting and readability, making your analysis clearer and more impactful. This template is designed to be adaptable to different data ranges and can be easily customized to suit your specific needs. Let’s explore the template and how to effectively utilize it.
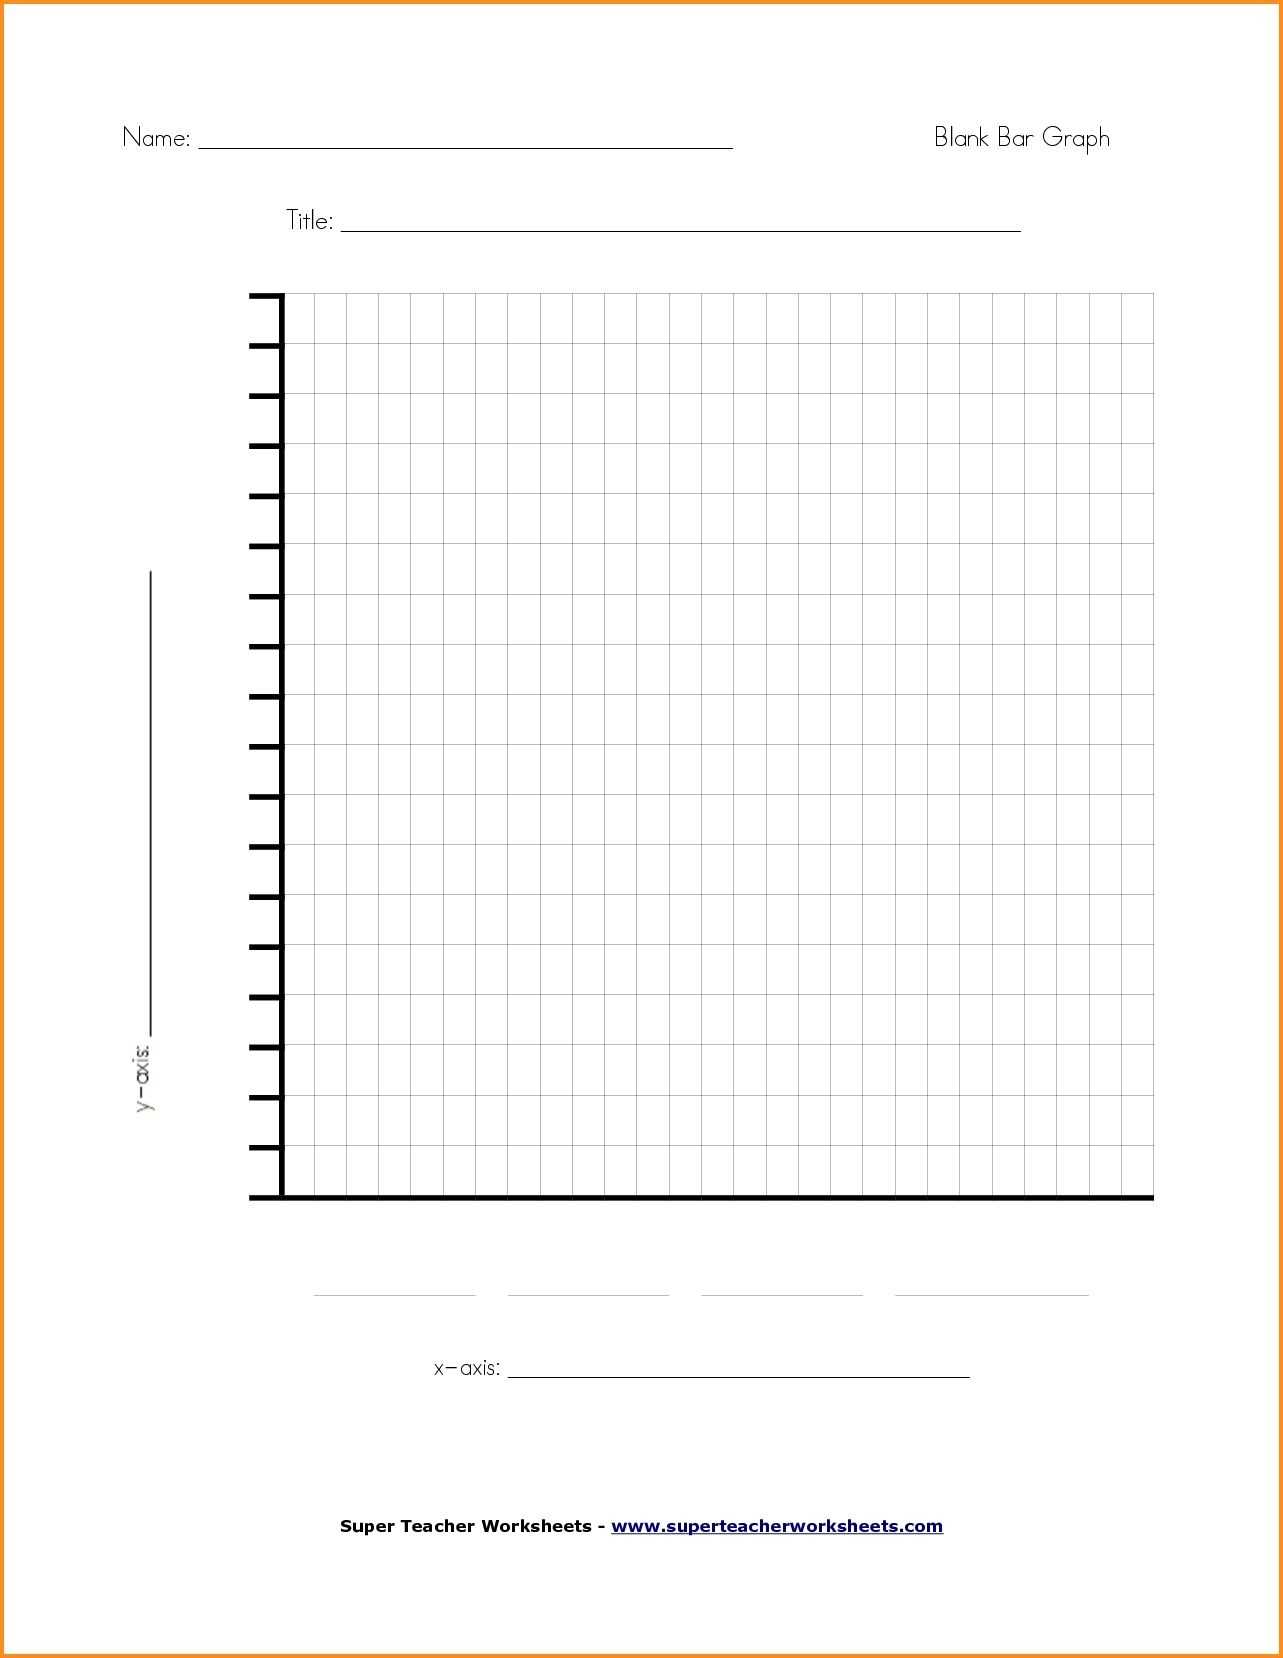
Blank Stem and Leaf Plot Template
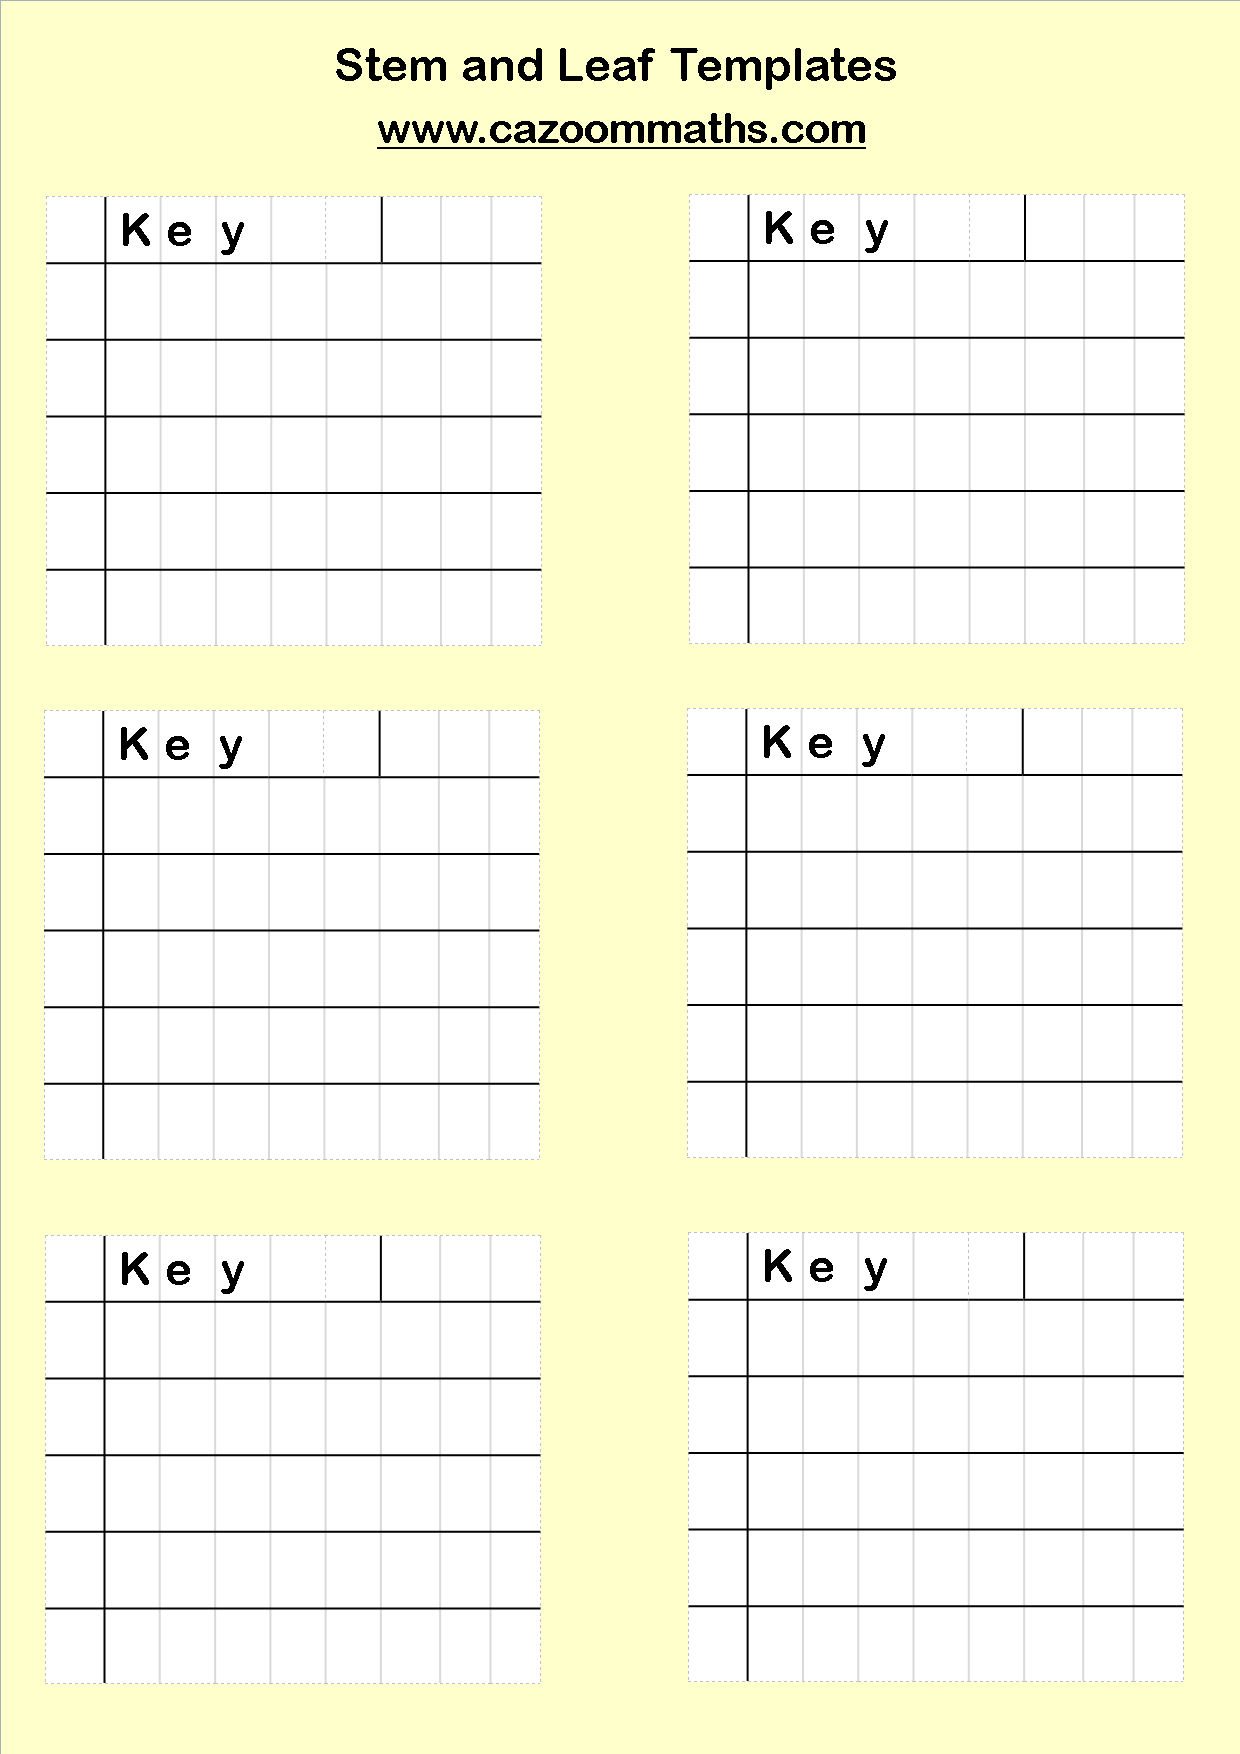
Below is a template ready for you to fill in with your data. The key is to organize the stems and leaves correctly to create a clear and informative visual.
Stem and Leaf Plot Template:
- Title: [Descriptive Title for your Data]
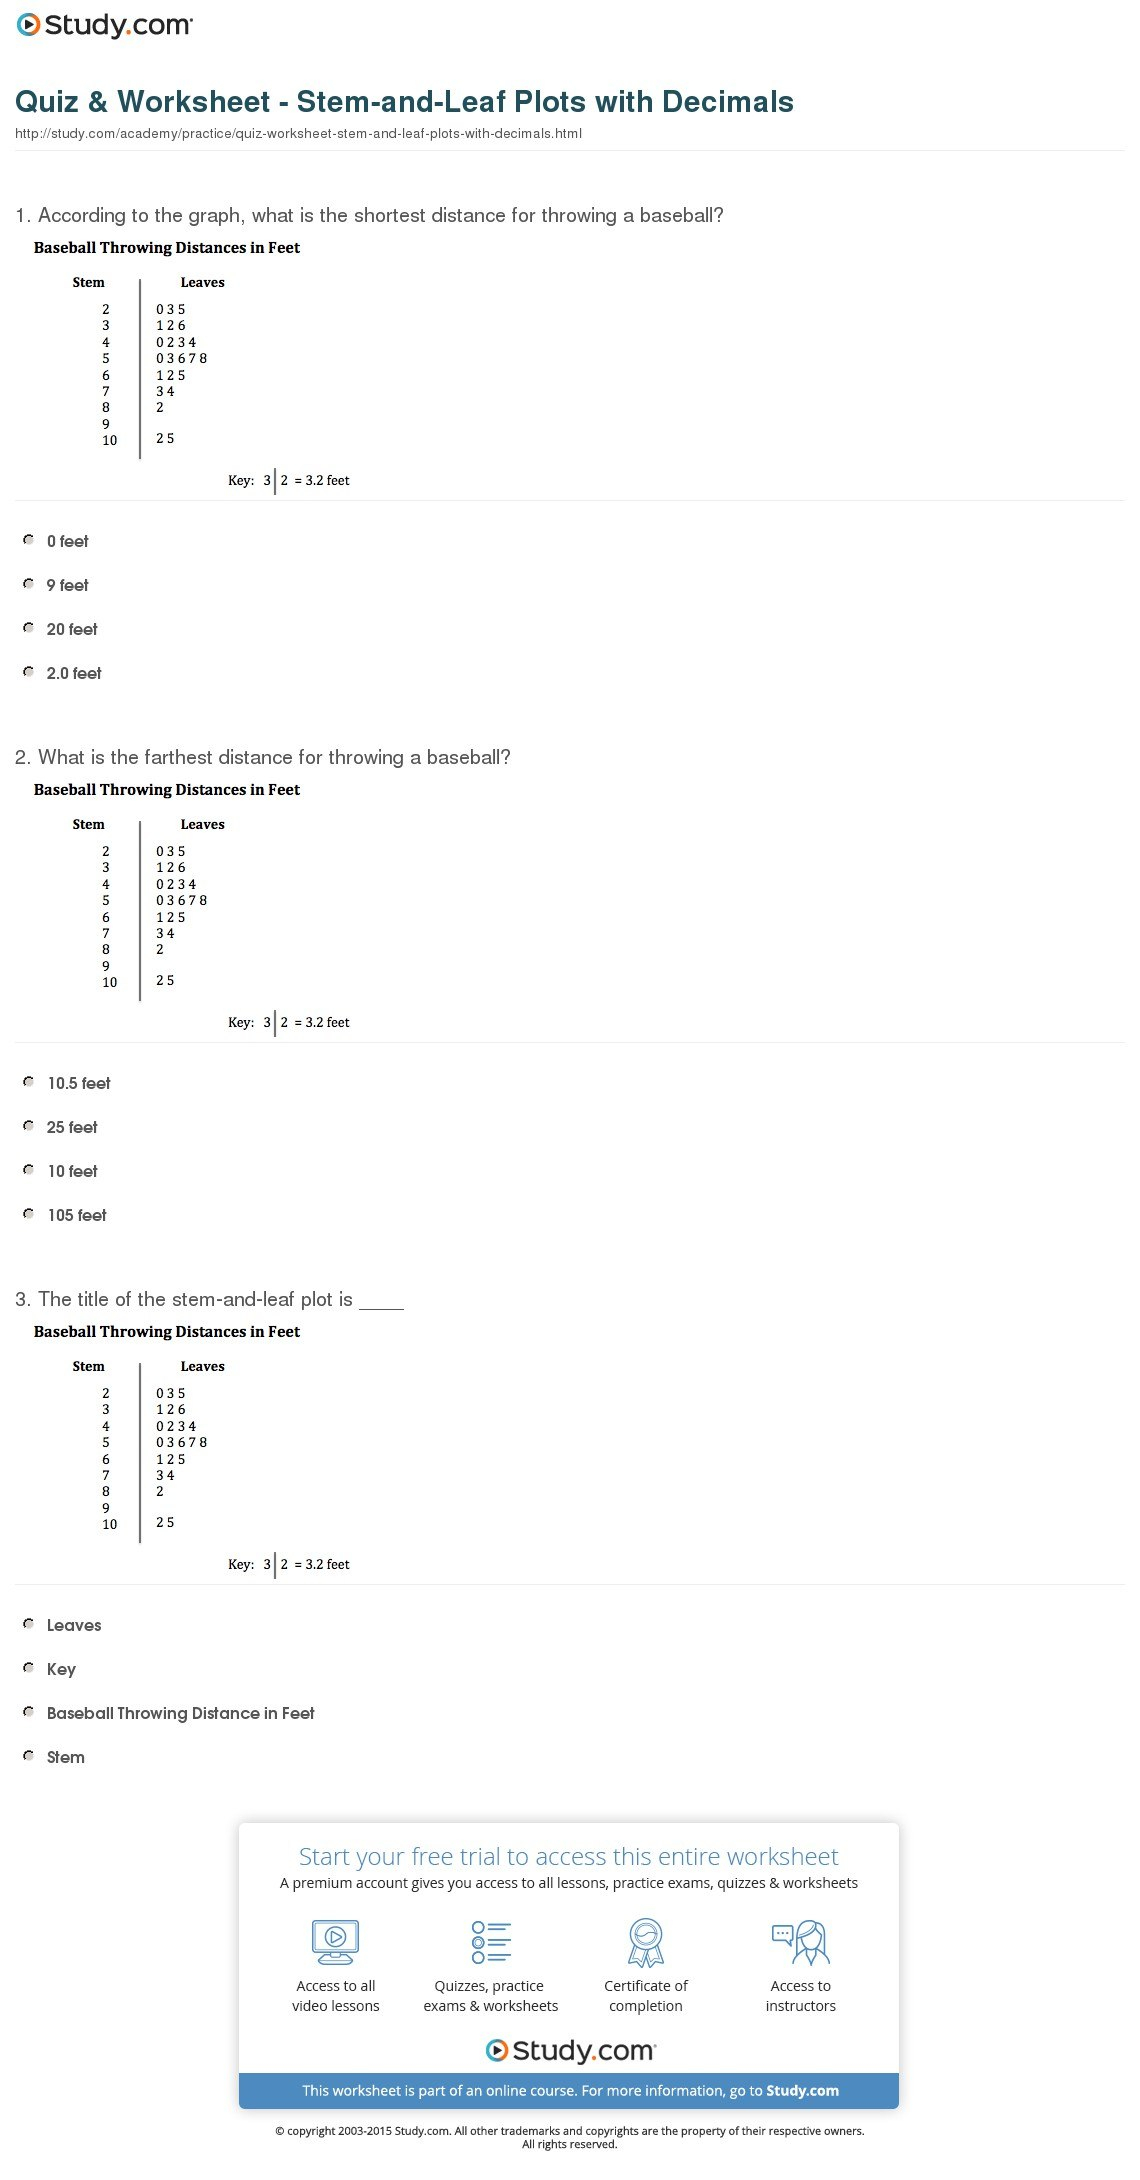
- Key: [Explanation of what the stem and leaf represent, e.g., 3|7 represents 37]
- **Stem** | **Leaf**
- ——- | ——–
- [Lowest Stem Value] |
- |
- |
- |
- |
- |
- |
- |
- |
- [Highest Stem Value] |
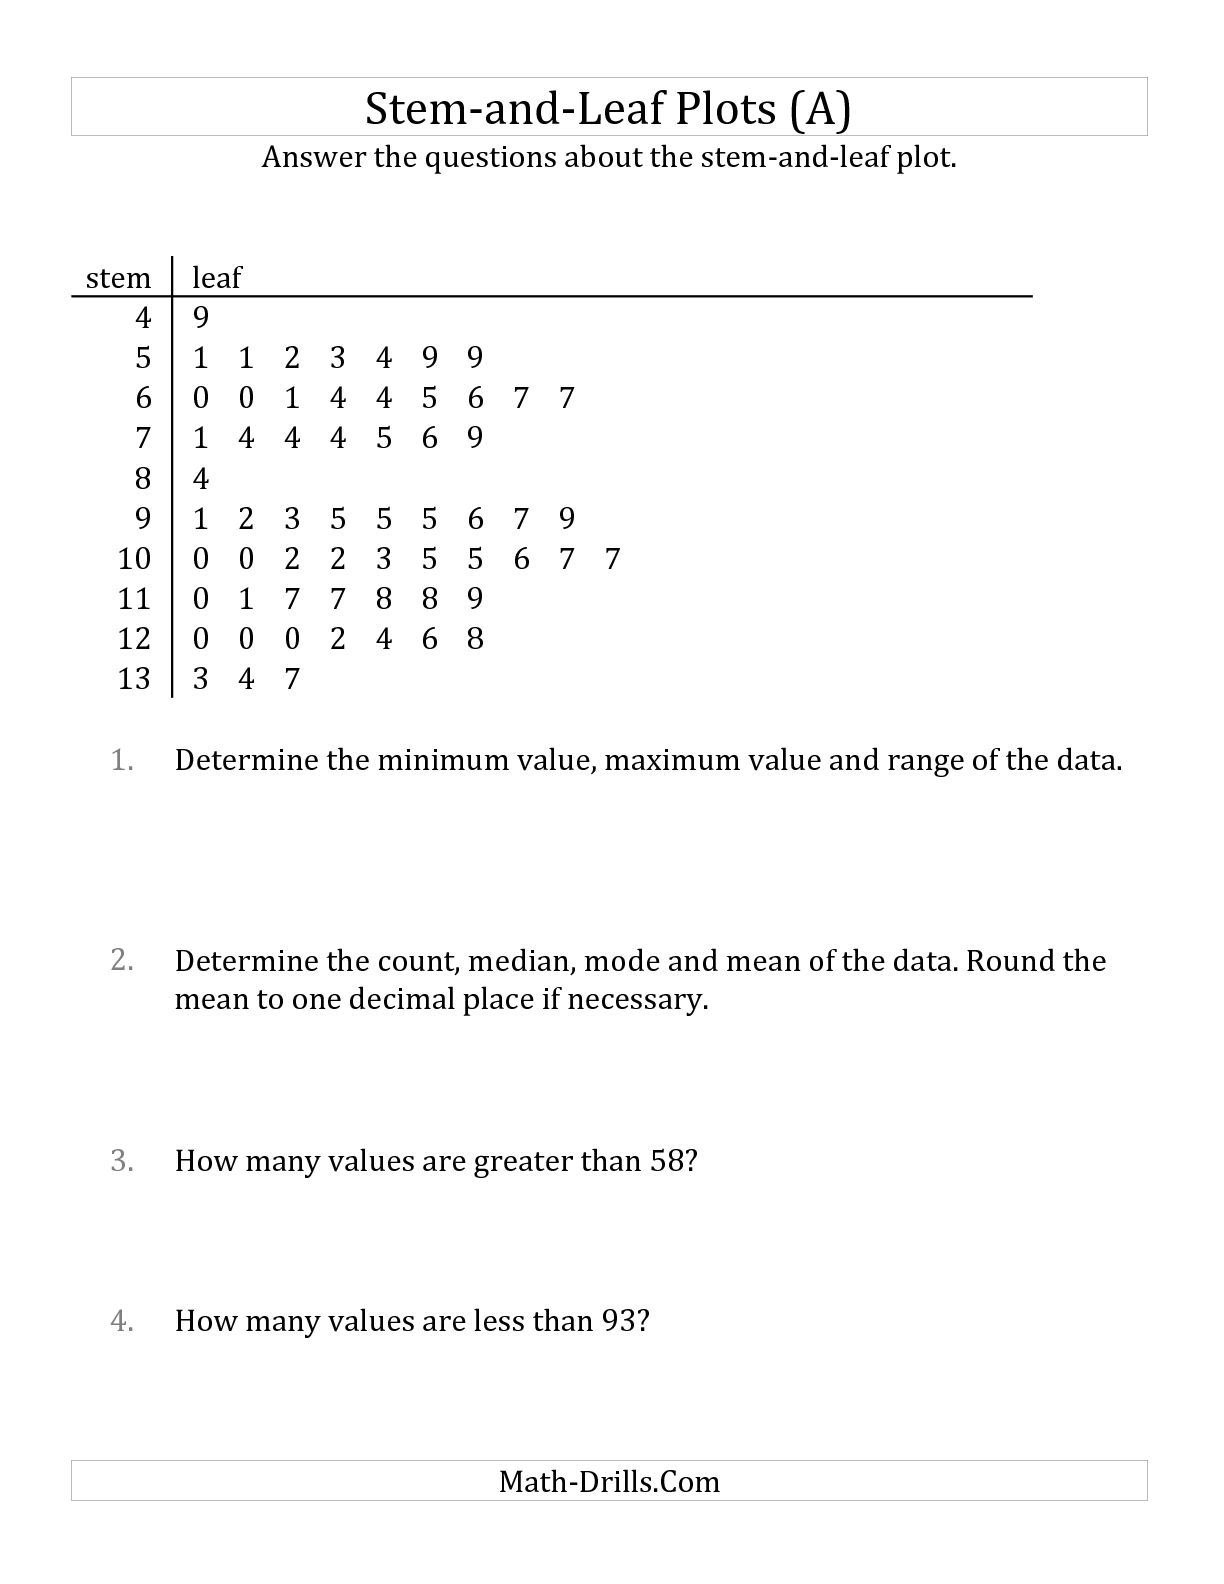
Instructions for Using the Template:
- Collect Your Data: Gather the numerical data you want to represent in the stem-and-leaf plot.
- Determine the Stem and Leaf Values: Decide which digits will form the stem and which will form the leaf. The stem should be the same for multiple data points. The leaf is typically the last digit, but this can be adjusted depending on the data range.
- Create the Stem Column: List the stems in ascending order in the left column of the template. Make sure to include all possible stems, even if they don’t have corresponding leaves. This helps illustrate gaps in the data.
- Add the Leaves: For each data point, find the corresponding stem and write the leaf value in the right column. Write the leaves in ascending order for each stem. Separate each leaf with a comma or space to improve readability.
- Add a Key: The key explains how to interpret the stem and leaf values. For example, “2|5 represents 25”. This is essential for anyone viewing the plot to understand the values represented.
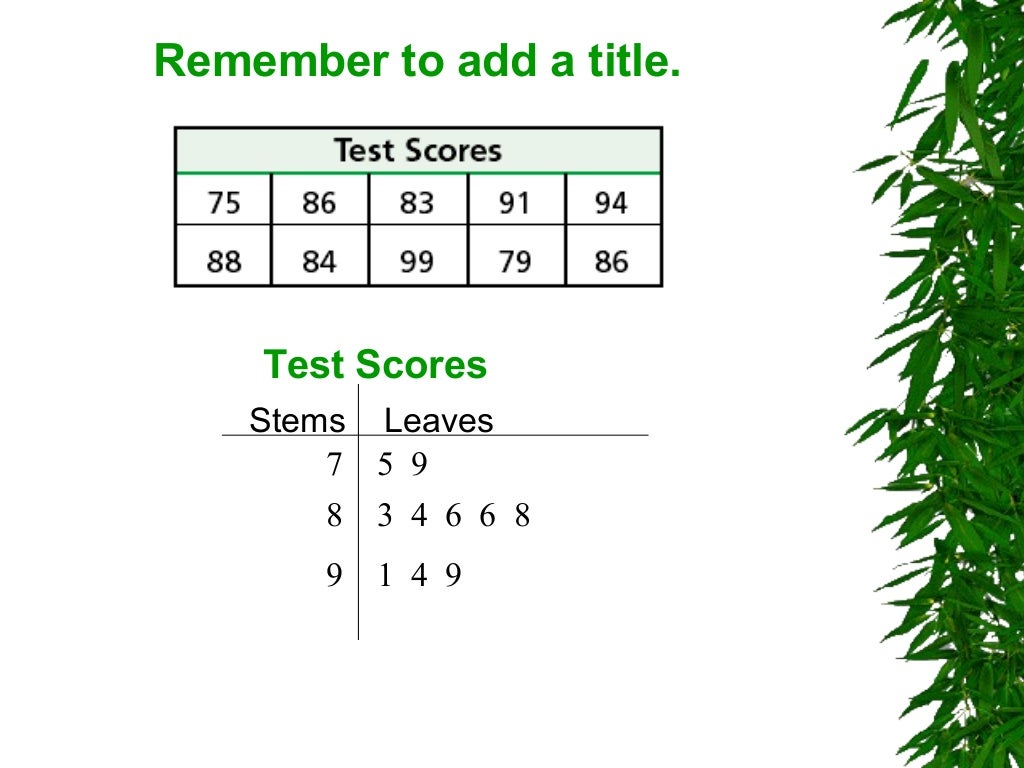
- Add a Title: Give your stem-and-leaf plot a descriptive title that explains what the data represents. This makes the plot self-explanatory.
Example Usage:
Suppose you have the following dataset: 22, 25, 28, 31, 33, 33, 35, 38, 40, 41, 42, 45, 49.
Using the template, the stem-and-leaf plot would look like this:
- Title: Test Scores
- Key: 2|2 represents 22
- **Stem** | **Leaf**
- ——- | ——–
- 2 | 2, 5, 8
- 3 | 1, 3, 3, 5, 8
- 4 | 0, 1, 2, 5, 9
By using this blank stem-and-leaf plot template, you can efficiently organize and visually represent your data, gaining valuable insights and improving your understanding of the data’s distribution. Remember to choose appropriate stems and leaves, arrange the leaves in order, and always include a key to ensure clarity.
If you are searching about Blank Stem And Leaf Plot Template – Sampletemplate.my.id you’ve came to the right web. We have 22 Pics about Blank Stem And Leaf Plot Template – Sampletemplate.my.id like Blank Stem And Leaf Plot Template – Creative Sample Templates, New Blank Stem And Leaf Plot Template – Sparklingstemware and also Blank Stem And Leaf Plot Template – Creative Sample Templates. Read more:
Blank Stem And Leaf Plot Template – Sampletemplate.my.id

www.sampletemplate.my.id
Blank Stem And Leaf Plot Template – Rebeccachulew.com

www.rebeccachulew.com
Stem And Leaf Plot Worksheet Pdf — Db-Excel Inside Blank Stem And Leaf

thevanitydiaries.com
Ppt – Exploratory Data Analysis (Eda) In The Data Analysis Regarding
business.fromgrandma.best
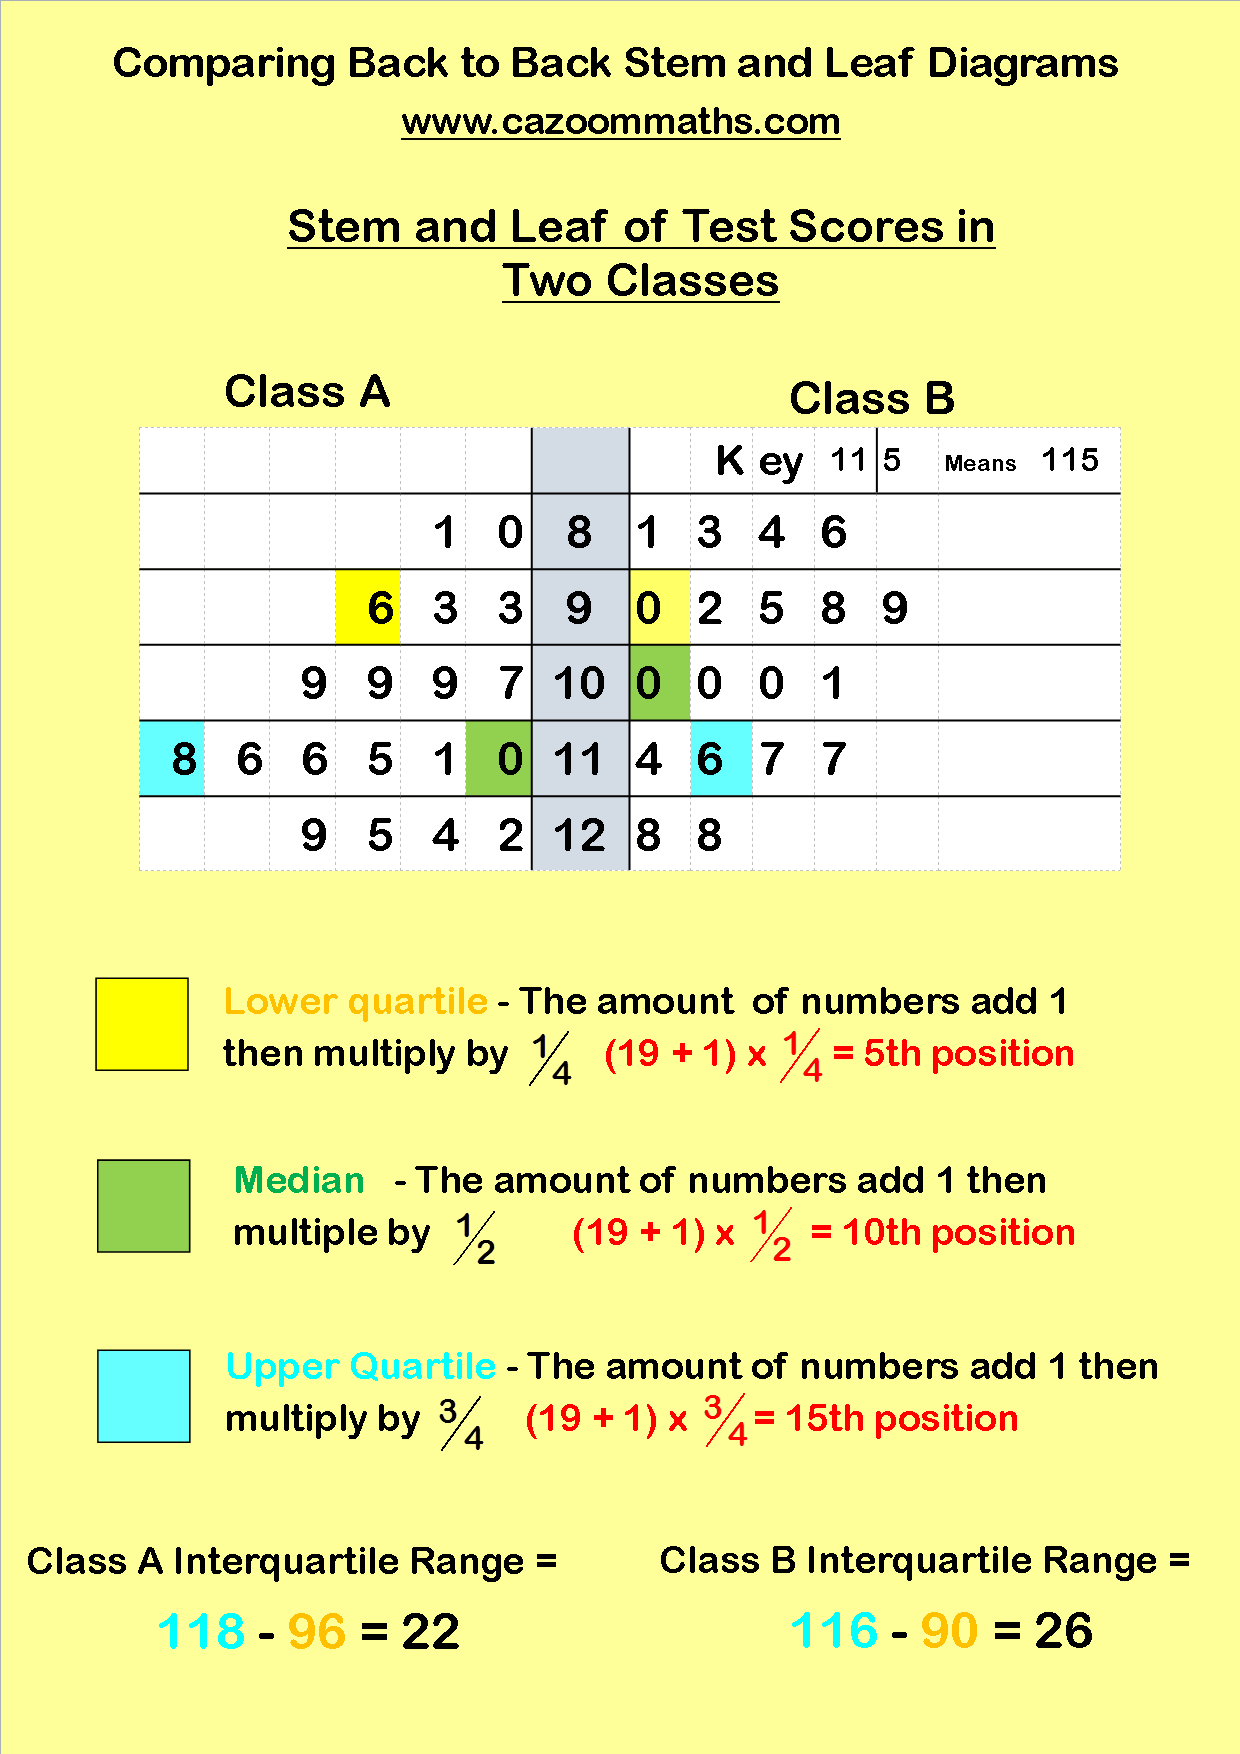
Quiz Worksheet Back To Back Stemandleaf Plots Study With Blank Stem And
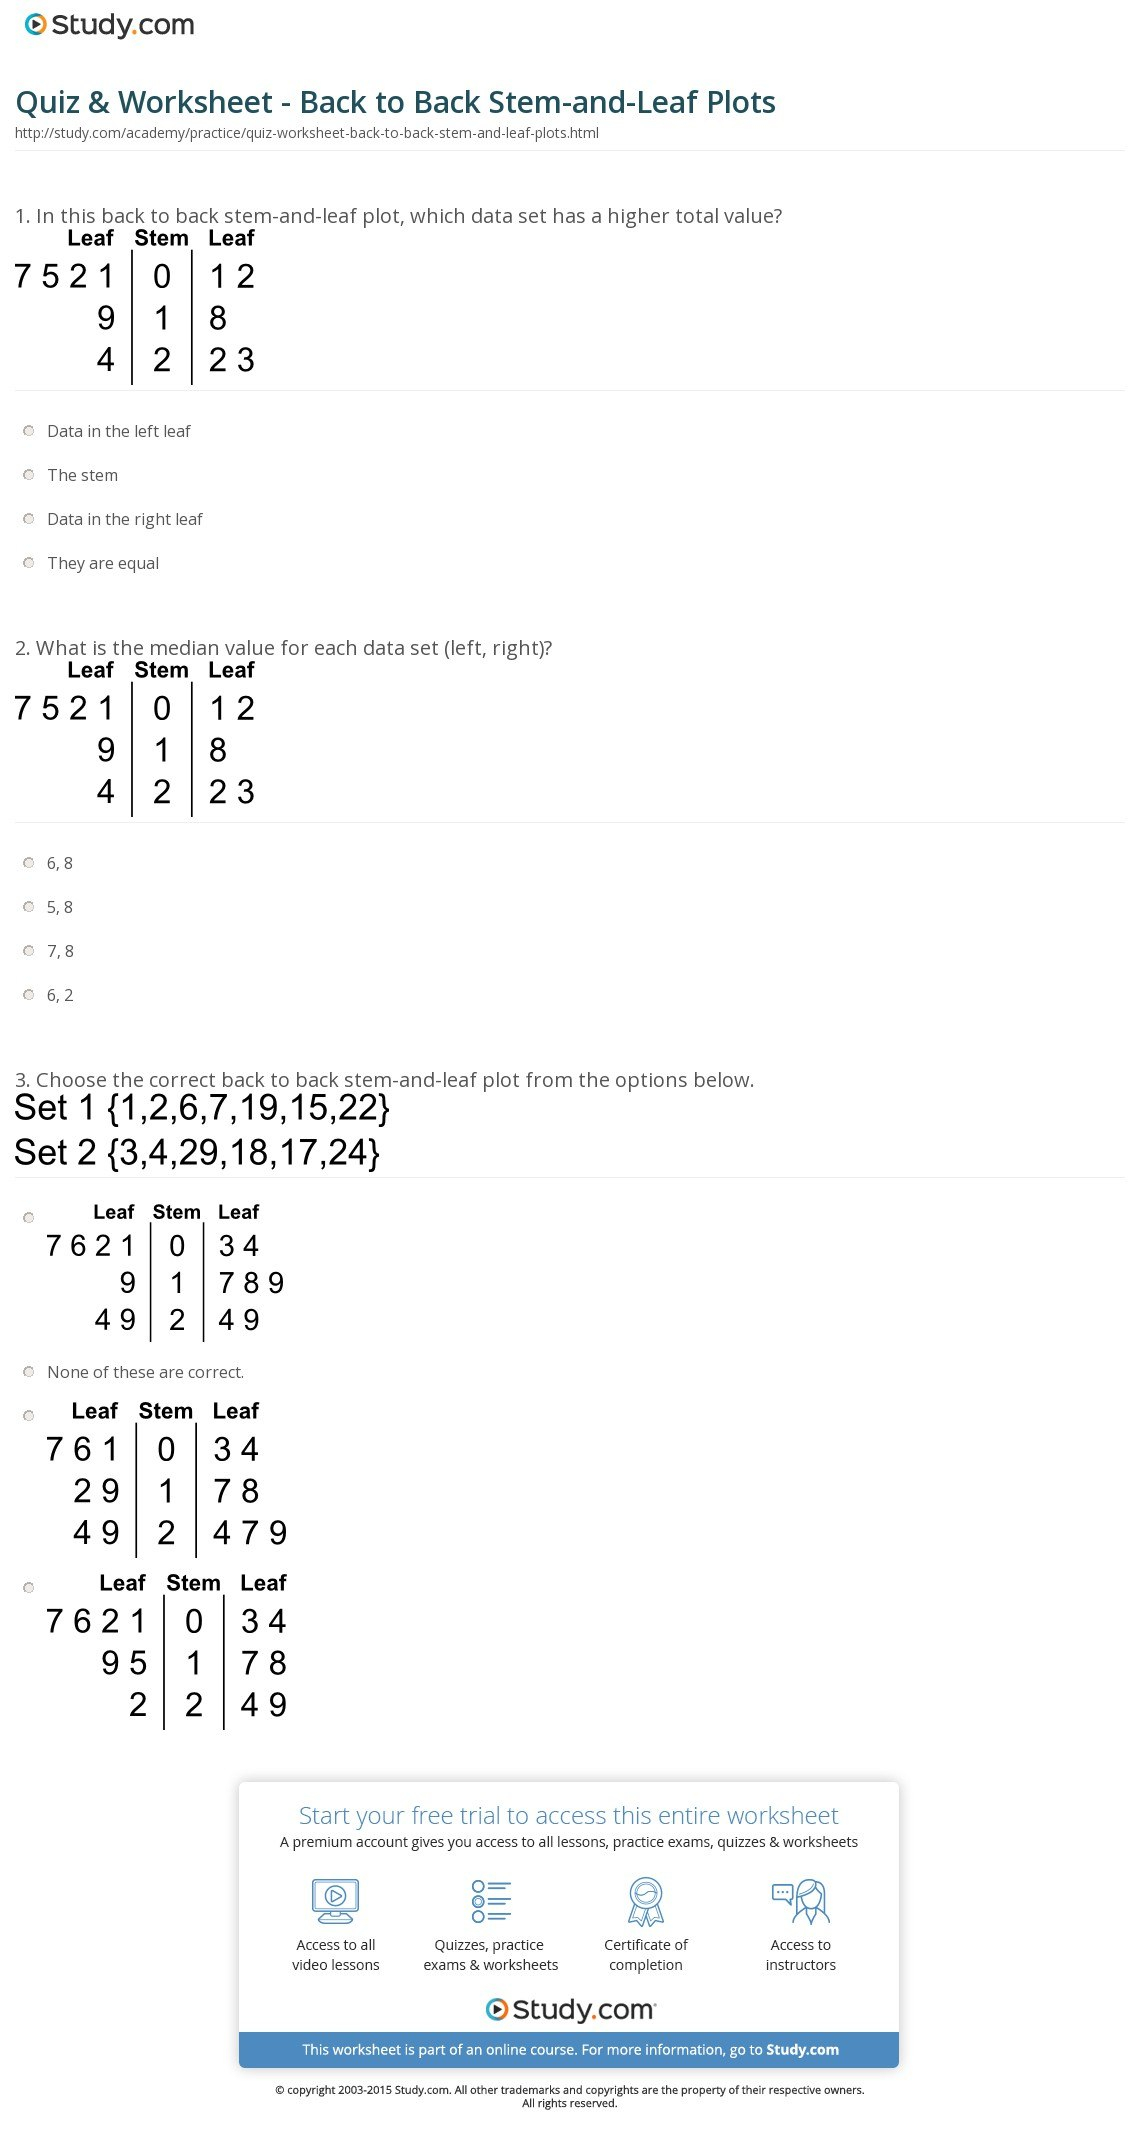
vancecountyfair.com
Stem And Leaf Plot Worksheet Answers | Briefencounters With Blank Stem
www.atlantaauctionco.com
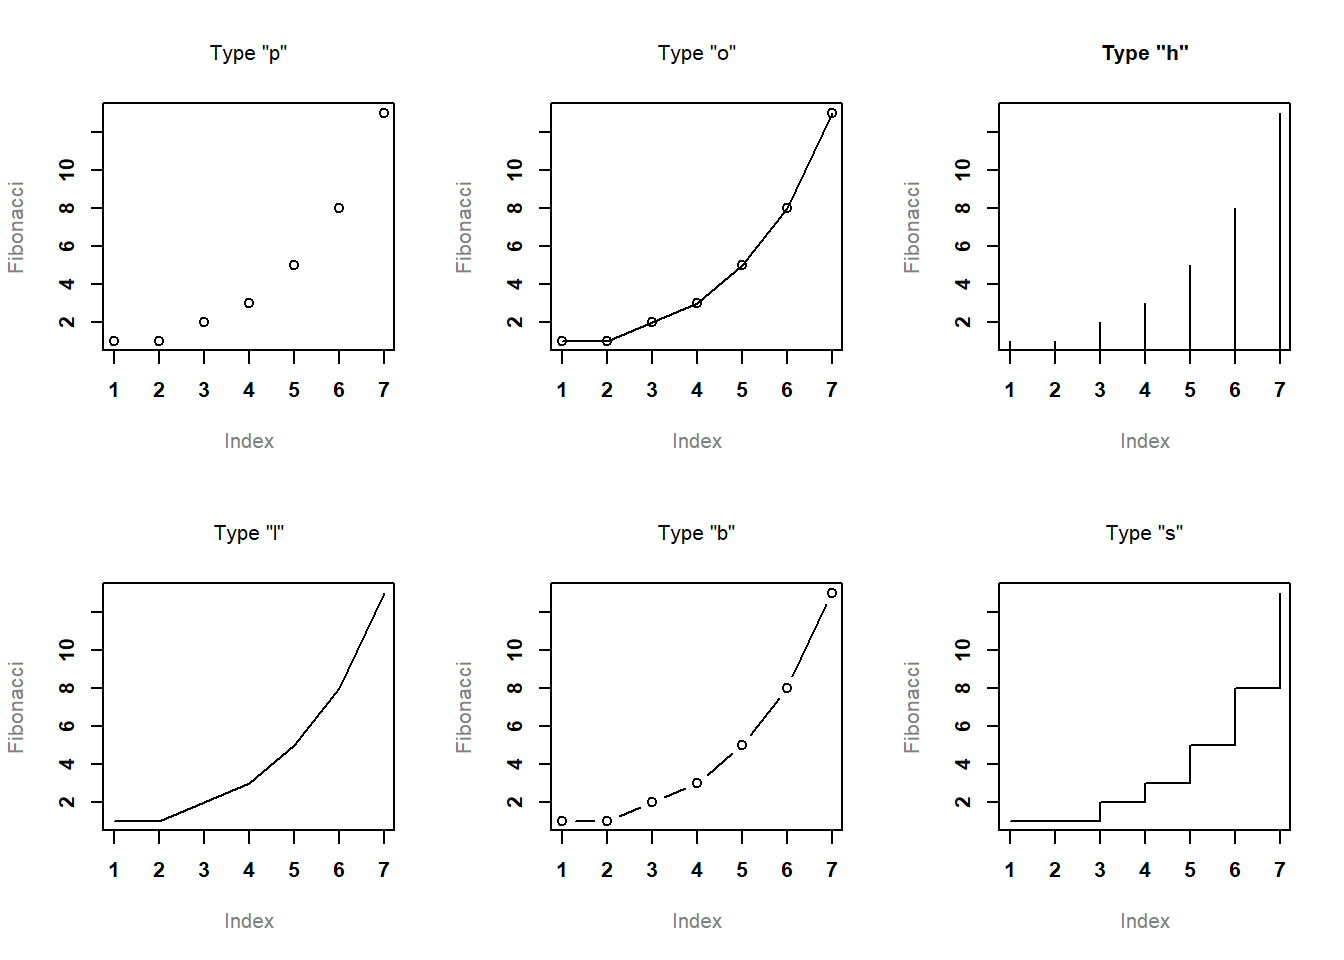
Chapter 6 Drawing Graphs | Learning Statistics With R: A Intended For
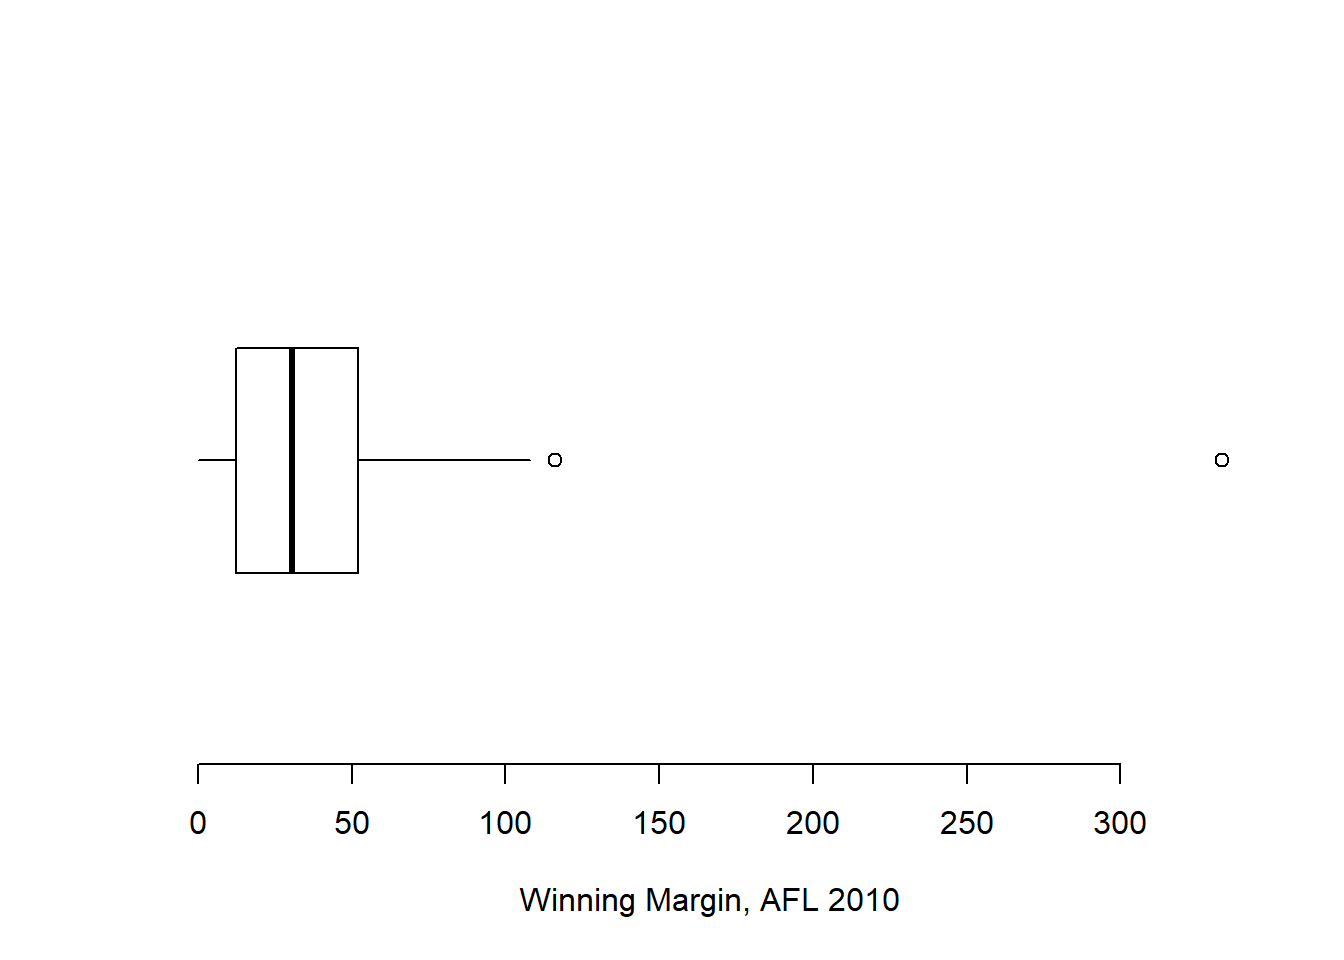
cloudflare.itsnudimension.com
Free Blank Stem And Leaf Plot Template – Sparklingstemware

sparklingstemware.com
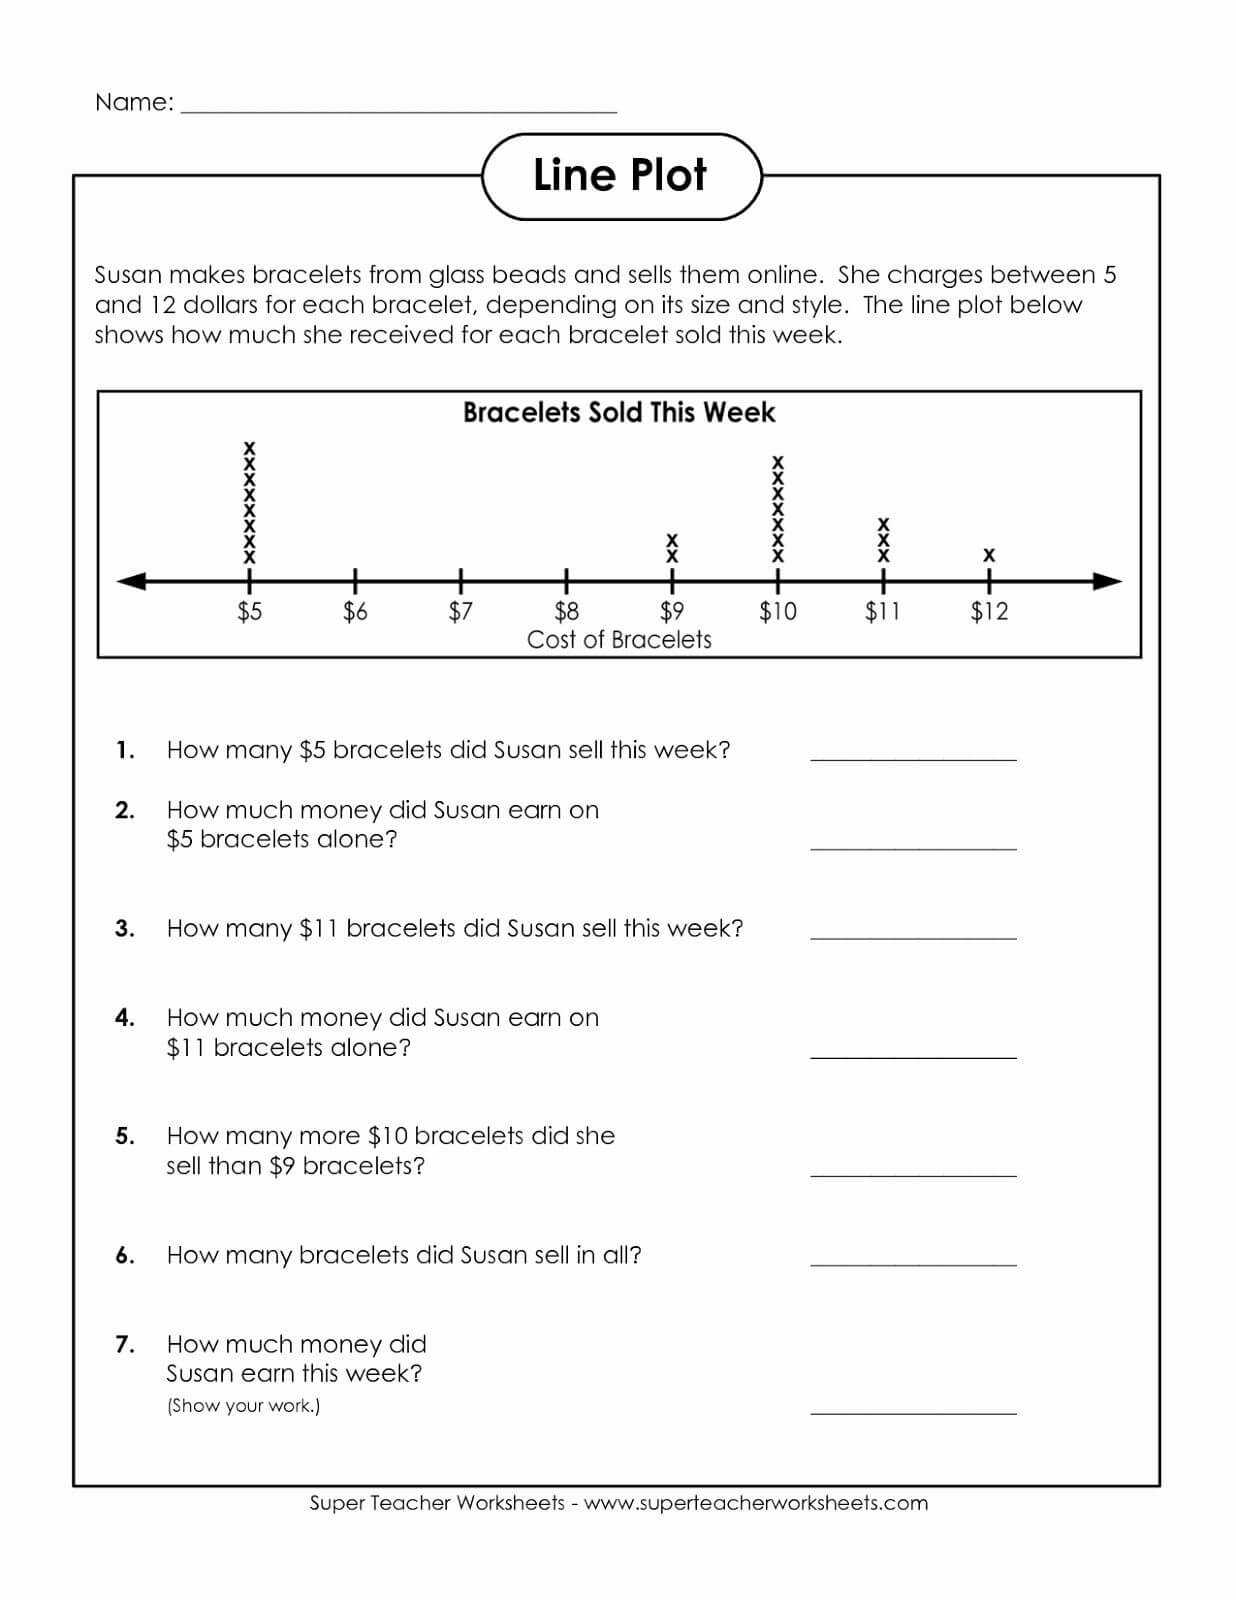
Blank Line Chart Template | Writings And Essays Corner Regarding Blank
www.xfanzexpo.com
Blank Stem And Leaf Plot Template – Rebeccachulew.com
www.rebeccachulew.com
PPT – Stem And Leaf Plots PowerPoint Presentation, Free Download – ID
www.slideserve.com
PPT – Stem And Leaf Plots PowerPoint Presentation, Free Download – ID

www.slideserve.com
Blank Stem And Leaf Plot Template – Professional Template Inspiration

professionaltemplateinspiration.blogspot.com
Chapter 6 Drawing Graphs | Learning Statistics With R: A In Blank Stem
www.xfanzexpo.com
Stem And Leaf Plots | Unit 10 Data Analysis | Leaves With Blank Stem
www.xfanzexpo.com
Quiz Worksheet Stemandleaf Plots With Decimals Study Inside Blank Stem
vancecountyfair.com
Blank Stem And Leaf Plot Template 3 Templates Example – Vrogue.co
www.vrogue.co
New Blank Stem And Leaf Plot Template – Sparklingstemware
sparklingstemware.com
Blank Stem And Leaf Plot Template – 10+ Examples Of Professional
vancecountyfair.com
Blank Stem And Leaf Plot Template – Creative Sample Templates
cloudflare.itsnudimension.com
Stem And Leaf Plots Explained—Simple Definition And Examples — Mashup Math

www.mashupmath.com
Statistics Teaching Resources Ks And Ks Statistics Worksheets For Blank
vancecountyfair.com
Stem and leaf plot worksheet answers. blank stem and leaf plot template 3 templates example. stem and leaf plot worksheet pdf — db-excel inside blank stem and leaf …